Viewing Related Items
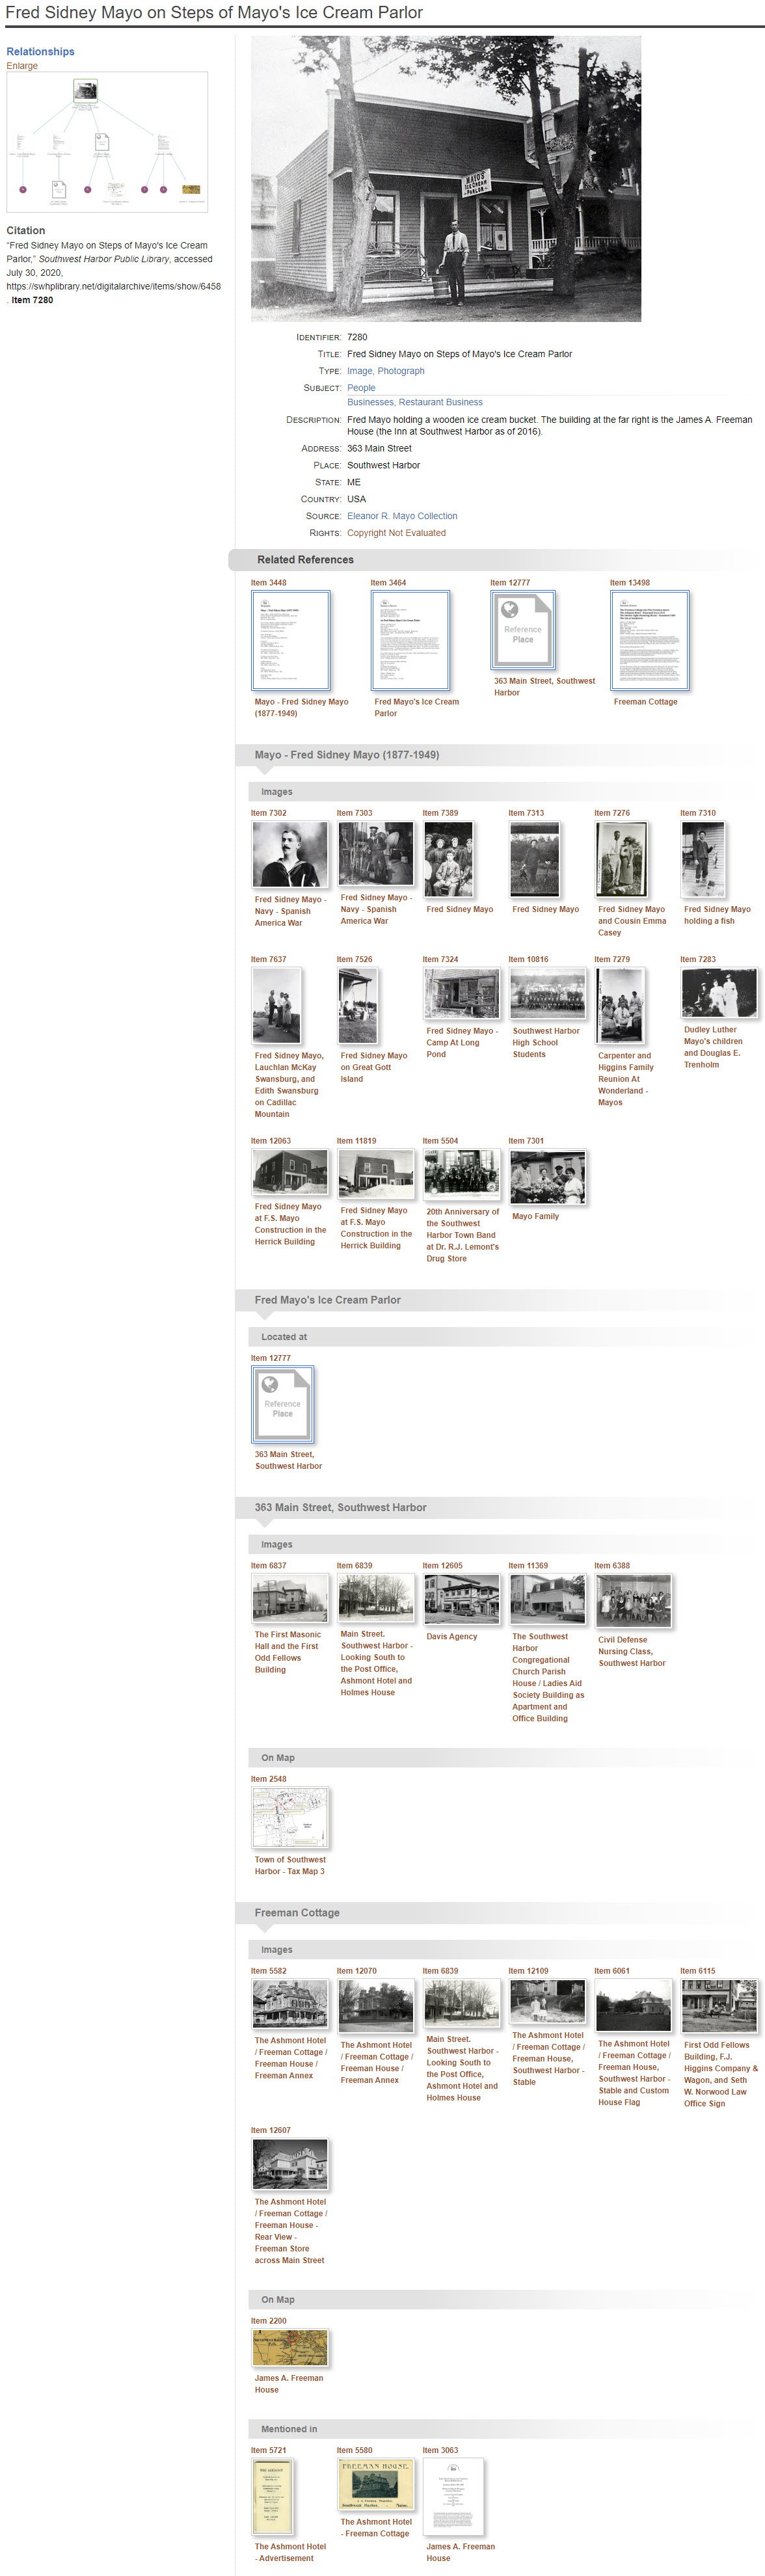
When you view the page for one item in the Digital Archive, you also see other items in the collection that are related to the item you are viewing. Not every item has related items, but some have quite a few as shown in the very long screenshot below for item 7280.
On the left side of the screen, in the Relationships section, a visualization preview graphically depicts all of this item's related items. A closeup of the visualization is shown after the screenshot below. Thumbnails for each related item display under the item's metadata, grouped by the type of relationship. The groups are separated by horizontal gray bars.
Every item page has this same form. The visualization provides a high level view of the item's relationships, and a thumbnail image and title display for every related item. You can click the title of a related item to go to that item's page, or you can click its thumbnail to see a larger picture.
View this item in the Digital Archive
Visualization
The Digital Archive uses a technique called Data Visualization to graphically represent an item's relationships. A visualization shows items as thumbnails with labeled lines between them to represent how the items are related to each other.
When you click the Enlarge link just above the visualization preview shown in the screenshot above, you see a larger version of the visualization as shown below. In a visualization, the item you are viewing, known as the primary item, appears with a green border around it. In this example, the primary item is 7280. In this visualization the primary item appears at the top, but the it can appear anywhere within the visualization depending on the layout and the number of related items.
This visualization reveals that item 7280 has direct relationships to the four items on the middle row, and indirect relationships to all of the items on the bottom row.
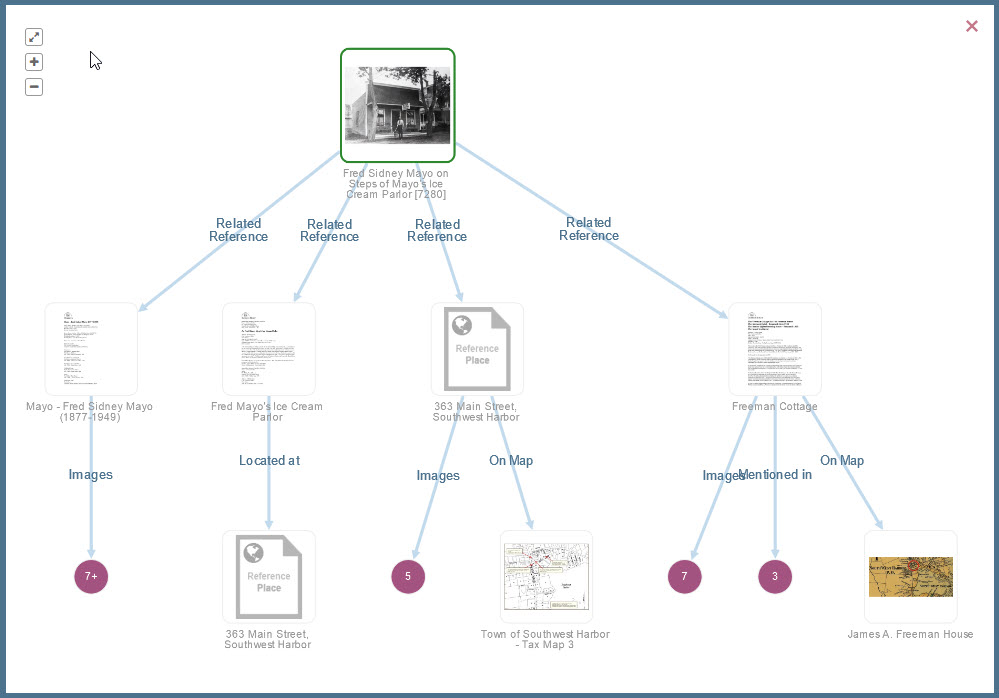
To keep the visualization diagram from becoming too cluttered, groups of two or more items having the same relationship to their primary item are consolidated into expandable purple dots. The number inside the purple dot indicates the number of items in the group.
When you click on a purple dot, the visualization changes to display those items. The screenshot below shows what you see when you click on the purple dot that has "5" in the center.
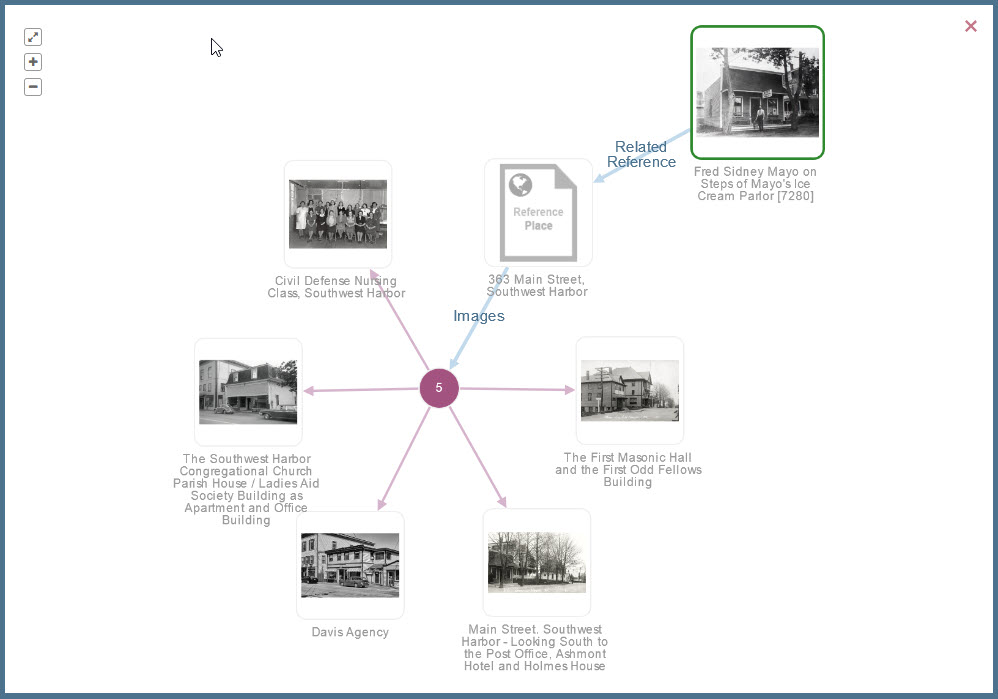
In the expanded visualization, you can click on the purple dot in the center, or click on the primary item at upper right, to go back to the previous visualization. In any visualization, you can click on a thumbnail to go to that item's page.
The visualization does not display images for hybrid items. It will display placeholder images instead.